
No items found.

Often data is a large array of disparate information. For their grouping and subsequent analysis, a special method is used - clustering.
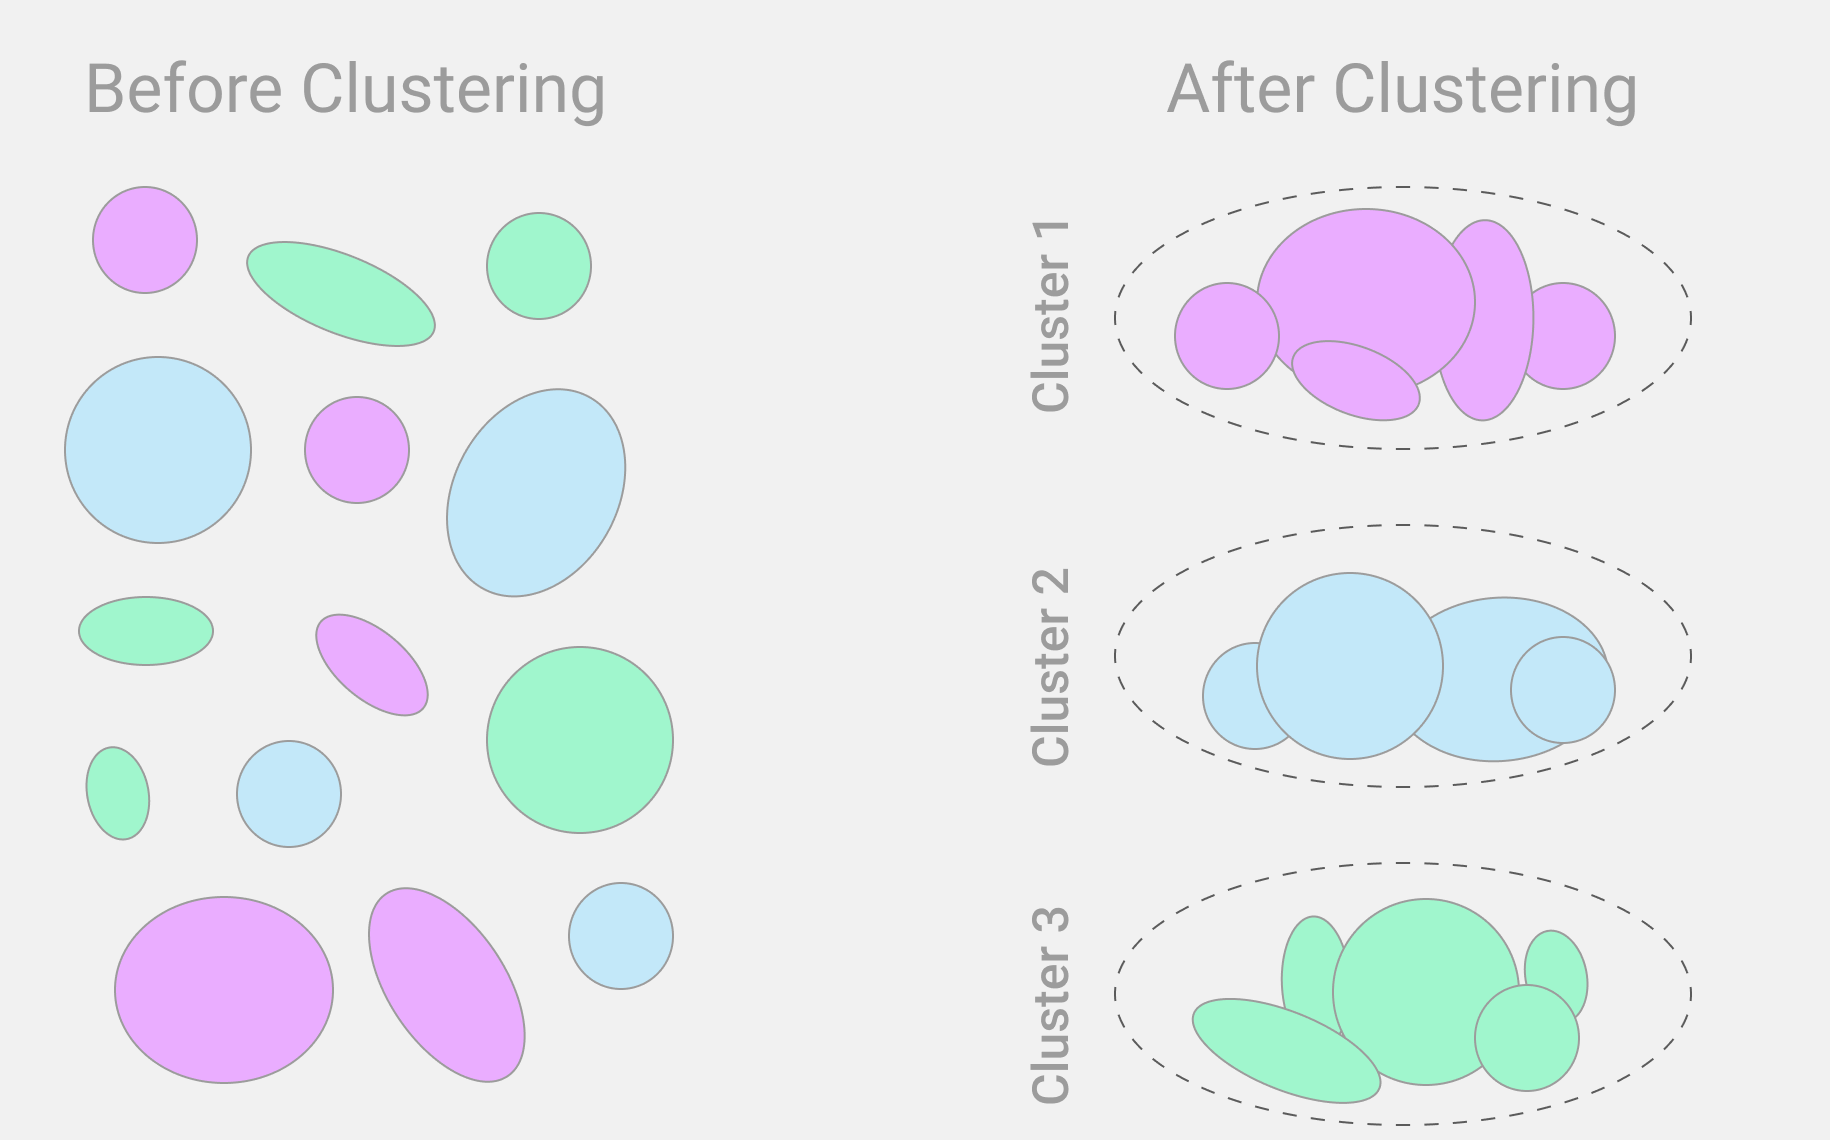
Cluster Analysis
Cluster analysis, or clustering, is the division of a large group of objects into several smaller ones. Each small group is called a cluster. The cluster is formed on the basis of some specific criterion. It can be any feature of the object: size, shape, category, type. Within one cluster, objects may differ in other criteria, but they must be similar in at least one.
Let's take real data of visitors of an online store as an example. Each of them has a profile in which the age is indicated. You can apply a cluster analysis algorithm to them and divide visitors into clusters by age: up to 18 years old, from 18 to 25 years old, from 26 to 30 years old, from 31 to 40 years old, from 41 to 50 years old, from 51 years old and older. Then these clusters can be used for further analysis: what people of a particular age buy more often, how much time they spend in an online store, what is the total amount of their purchases, and so on.
.png)
Inside the cluster, you can cluster again, that is, select subclusters. This will form a hierarchical structure in which each object corresponds to several clusters, from smallest to largest.
In cluster data analysis with overlapping clusters, one object can belong to two or more clusters if it has the same criteria.
When to Apply
Cluster analysis can be applied where there are data arrays with different characteristics. At the same time, it's important that there are common features, otherwise it simply will not work to cluster the data.
Clusters can be divided into:
- Clients to analyze the behavior of individual client groups.
- Business competitors for market research.
- Diseases to study recovery statistics.
- Survey respondents to analyze the opinions of different groups of people.
- SEO-keys for forming the themes of the site pages.
- Collected files of different formats for easy processing.
There are many more applications, because clustering can be applied to almost any data that needs to be systematized and structured.
Clustering Goals
Dividing data into clusters has four main goals:
- Understanding. Dividing disparate data into groups helps the analyst understand exactly what data is collected. Then it will be easier to process them - for example, to apply specific analysis methods to different clusters.
- Anomaly detection. After clustering, some data may appear that does not belong to any of the clusters. It needs to be studied in order to understand whether this is a mistake or some interesting phenomenon.
- Expansion. Sometimes when collecting information, some data has more features, while others have less. Clustering will help to suggest missing features in other elements of the cluster. For example, customers in the male cluster are known to spend an average of 15 minutes on the site. If a new person appears in the cluster with an unknown time spent on the site, it can be assumed that for him it is also equal to 15 minutes.
- Compression. If there is too much data, you can divide them into clusters, average them, and leave one object for each cluster. This will allow further analysis to use less power.
In my opinion, data clustering is not directly analysis, but a preliminary stage. It facilitates the use of other methods of analysis.