No items found.

Python is often used by data analysts. For better performance, it has extensions - libraries, and sets of ready-made tools for more efficient work.
1. pandas: Data Preparation
Before analyzing the data, it needs to be prepared: collected, cleaned of errors and duplicates, structured. To be sure of the result at the end of the analysis, it's important to verify the quality of the data at the beginning. The pandas Python data analysis library helps transform structured data and clean it up.
Features:
- Allows you to work with huge amounts of data, including merging and splitting them.
- Supports DataFrames, special objects that allow you to more efficiently analyze data by turning it into indexed structured arrays.
- Accepts data from multiple sources: databases, Excel spreadsheets, and more. Converts data of different formats to those suitable for analysis by the Python.
With pandas you can:
- Index, rename, sort and merge datasets.
- Update, add and delete data.
- Recover and process missing data.
- Visualize data.
“Data is like garbage. You’d better know what you are going to do with it before you collect it.” - Mark Twain, writer, entrepreneur, and lecturer.
2. NumPy: Advanced Calculations
After the pandas library has helped to verify the quality of the data, you can move on to the calculations. For example, calculate the revenue of a retail outlet by product range. In Excel, you would have to concatenate, sum, and divide, but in Python, one row of a record might be enough to make a calculation on a table of 10,000 rows. The NumPy library helps with this. It is considered one of the main Python libraries for data analysis.
Features:
- A lot of data structures that allow for more efficient search, analytics and structuring.
- Ability to perform complex scientific calculations with mathematical formulas, including data in multidimensional arrays.
- Tools for converting data into different formats.
- Working with numeric and other data types.
With NumPy you can:
- Add, multiply, align, index arrays, slice them, and reshape.
- Create stack and broadcast arrays, split them into sections.
- Perform linear algebra calculations for complex data analysis.
3. SciPy: Mathematical Operations
With the skill experience, the tasks will become more complicated: resorting to linear algebra, interpolation, integration, statistics and other complex mathematical operations. SciPy library, which is built on the basis of arrays and NumPy functions, helps with this.
Features:
- Fast and reliable execution of complex operations thanks to optimization.
- A wide range of functions and tools for a variety of operations.
- Contains many sub-packages for specific tasks, such as Fourier transforms.
With SciPy you can:
- Perform complex mathematical calculations: for example, solve differential equations or find numerical solutions to integrals.
- Process images.
- Work with genetic algorithms.
- Perform complex engineering calculations.
4. Matplotlib: Data Visualization
After analysis, the data must be presented in a form that is easy to understand. For this, visualization tools are used. They are many other packages, but Matplotlib supports a maximum of various plots and charts.

Features:
- Allows you quickly build charts and graphs of various types, customize their design.
- Supports API for integrating graphs into developed applications.
- Knows how to format charts and graphs for easier perception.
With Matplotlib you can:
- Build 2D shapes.
- Generate line, scatter, column, pie and other charts based on data.
- Draw contour plots.
- Generate fields of vectors and spectrograms.
- Quickly embed visualization in services, programs and applications.
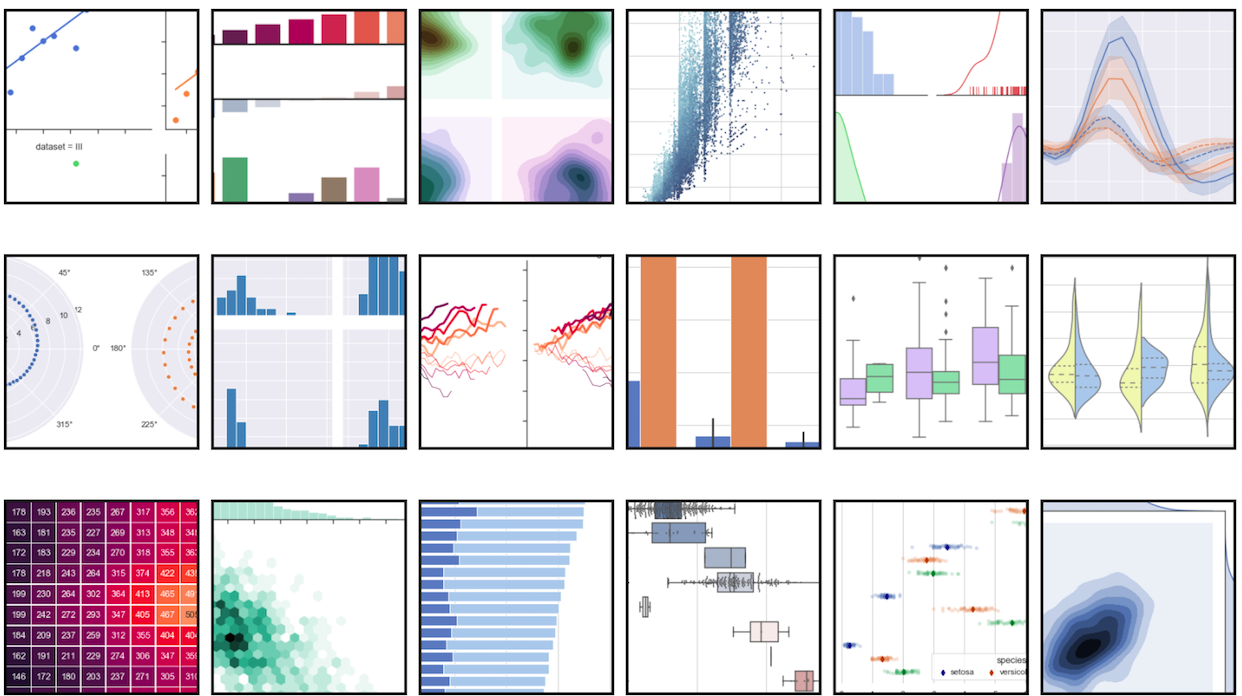
5. Seaborn: Advanced Visualization
This library is an extension of Matplotlib. It allows you to create more attractive and easy-to-read graphics that are easier to build and display.
Features:
- Tools for exploring and analyzing data before visualization.
- Support for data of different formats.
- Extensive options for customizing the appearance of graphs and creating complex visualizations.
With Seaborn you can:
- Calculate and visualize correlations - relationships between different data.
- Analyze and compare data with each other, build graphs based on this analysis.
- Create graphs suitable for demonstrating the visualization of the analysis to those who do not understand the data too deeply.
6. statsmodels: Statistical Analysis
Python has very few built-in tools for statistical analysis, which is inferior to some other languages for data analysis, such as R. The statsmodels library corrects this shortcoming. It combines the graphics capabilities of Matplotlib, pandas data preparation tools, and the mathematical functionality of NumPy and SciPy. Some features of the Patsy library are built into it, which allow you to implement formulas from the R language.
Features:
- Allows those who have experience in R to work more efficiently in Python, as it supports many methods from this language.
- Suitable for statistical calculations.
- Supports one-dimensional and two-dimensional data analysis, which allows you to build generalized models and test hypotheses.
- Most commonly used by Data Scientists for complex calculations.
- Good compatibility with other Python libraries and tools.
- Makes it easier to solve some complex mathematical problems.
With statsmodels you can:
- Build complex statistical models, such as linear regression.
- Run statistical tests.
- Calculate correlation.
- Build generalized linear and Bayesian models.
- Test hypotheses in various ways.
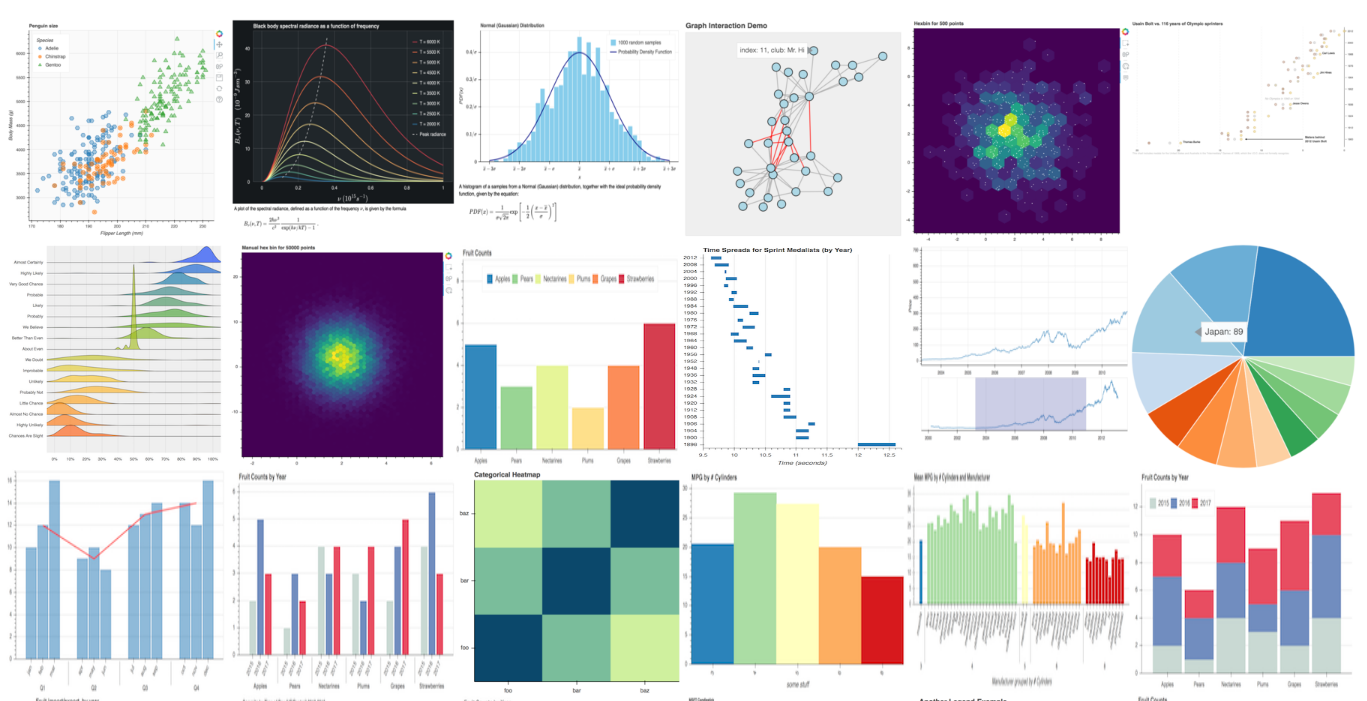
7. Plotly: Interactive Visualization
Sometimes analysis requires not just graphs and charts, but more complex structures: interactive maps, three-dimensional charts, and other entities. Plotly supports almost all types of visualizations that are used in science and data analysis. The best part is that you can move the mouse over the graph and see the values of data slices.

Features:
- Supports 3D renderings and their advanced settings.
- Allows you to export analysis results in a special format - JSON.
- Has one of the widest lists of supported charts.
- Able to send data to cloud services to work with them further.
- Based on this library, there is another one, Dash - it allows you to build interactive dashboards for displaying data.
With Plotly you can:
- Build any conventional charts and graphs: pie, Gantt, tree.
- Generate scientific maps: thermal, contour, logarithmic, with vector fields.
- Build financial charts.
8. Bokeh: Web Interactive Visualization
Often the results of data analysis need to be demonstrated in some application. To do this directly, you can use Bokeh, a library that allows you to create interactive graphics and immediately publish them to web services.
Features:
- Supports all the basic visualization tools needed in data analytics and science.
- Supports different input data formats.
- Versions for other programming languages - after mastering the library, it will be possible to use it when switching to another language.
- Compatibility with Python web development frameworks such as Flask.
- Compatibility with other visualization libraries such as Matplotlib.
With Bokeh you can:
- Quickly embed a nice interactive graph into a web page. It will automatically update when data changes and support sorting, slicing or other tools.
- Build graphs based on data imported from various sources.
- Perform simple data analysis, such as calculating correlations.
9. scikit-learn: Machine Learning
Machine learning models are usually handled by data scientists, but analysts sometimes have to deal with them too. As a rule, scikit-learn is used to write and configure them. It is one of the main Python libraries for Data Science.
Features:
- All the basic functions for machine learning are built into the library.
- You can create models for both supervised and unsupervised learning.
- Connection of mechanisms for evaluation of created models is available.
- There is integration with NumPy, SciPy and other libraries for computing.
With scikit-learn you can:
- Create machine models for classification, clustering, segmentation, data visualization and other manipulations.
- Choose from several models.
- Customize the parameters and features of the model.
- Preprocess training inputs.
Story from My Life
Me and my husband had a problem: we often had arguments. Then I decided to apply the knowledge of data analysis in life and collected data on arguments: based on when they happened and because of what, I built a graph. It turned out that most often "thunderclouds" thickened in the evenings, when some domestic/household issues were discussed. We would come home from work tired, with no desire to discuss something important, and so it would began. After analyzing the arguments, a decision was made: not to discuss complex everyday problems on weekdays, move all serious conversations to the weekend, and solve all the problems them in a cozy atmosphere.
So, with the desire to solve the issue, analytical skills and the usual seaborn graphics library, our relationships were saved. With this story, I want to say that analytical skills can help make more accurate and reasoned management decisions at any level of life, be it family or workplace. The libraries listed above will be a handy tool to help with this.